Understanding the Trading View Platform and Its Key Features
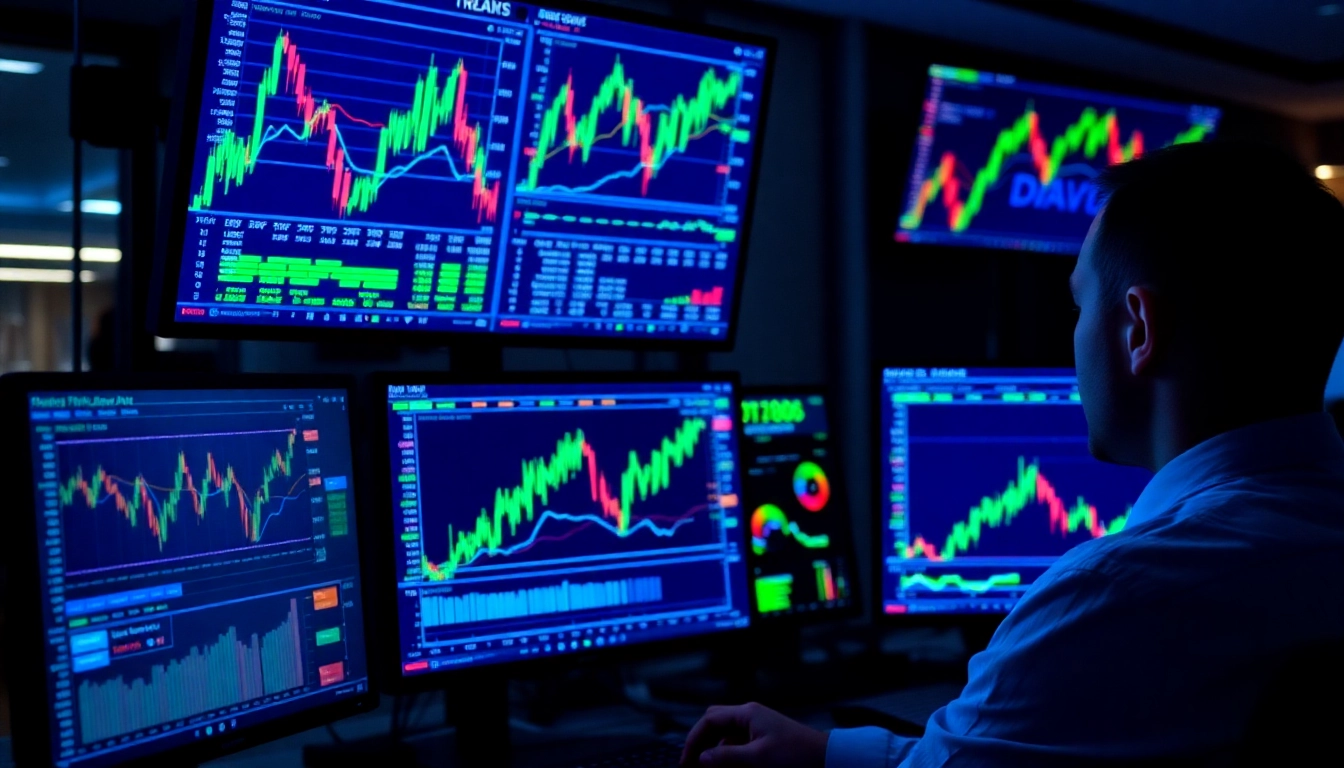
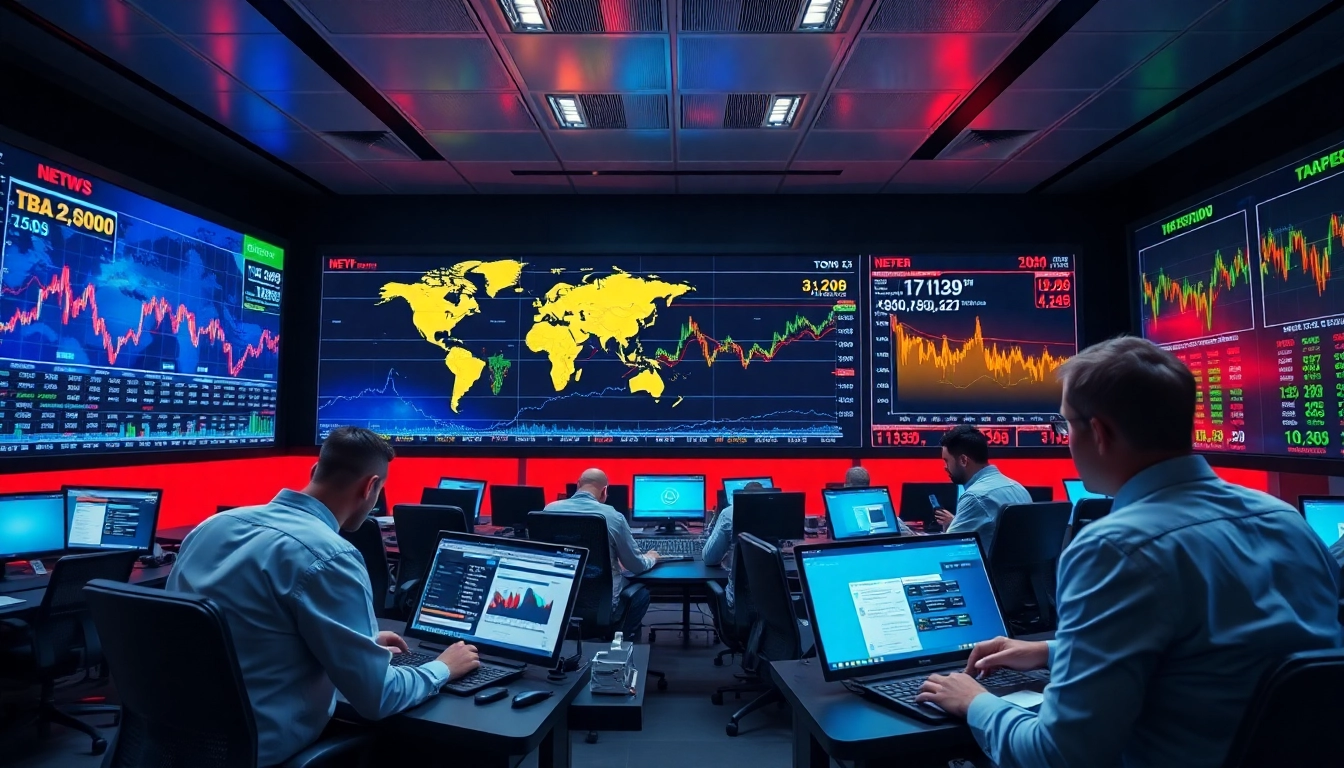
In today’s fast-paced financial markets, having access to real-time data, advanced analytical tools, and a vibrant community can significantly enhance a trader’s capability to make informed decisions. The trading view platform has emerged as a leading solution, combining powerful charting tools, social features, and automation for traders and investors worldwide. Whether you’re a seasoned professional or a novice, understanding the core components of this platform is essential to unlocking its full potential. This section explores the platform’s intuitive interface, comprehensive tools, and customization features that make it a versatile asset in market analysis.
Overview of Trading View’s Interface and Tools
Trading View’s interface is designed with user-friendliness and functionality at its core. The workspace is customizable, allowing users to set up multiple chart layouts, watchlists, and data feeds seamlessly. The core tools include interactive charts, real-time market data, and a vast library of technical indicators. The platform supports the analysis of diverse asset classes such as equities, cryptocurrencies, forex, commodities, and indices, making it a one-stop shop for multi-market trading strategies.
At the top, traders find a toolbar equipped with drawing tools—trend lines, Fibonacci retracements, geometric shapes—and annotation options. These allow for precise technical analysis and quick visual insights. The right panel hosts the current asset data, including bid-ask spreads, volume, and price changes, alongside functions like alerts and order execution (for supported trading accounts). The lower section provides access to social features—ideas, chat, and community insights—fostering a collaborative trading environment.
One standout feature is the platform’s cloud-based nature, enabling access from any device with internet connectivity—be it desktop, tablet, or smartphone—ensuring traders are always connected to the markets.
Customizing Charts for Better Visualization
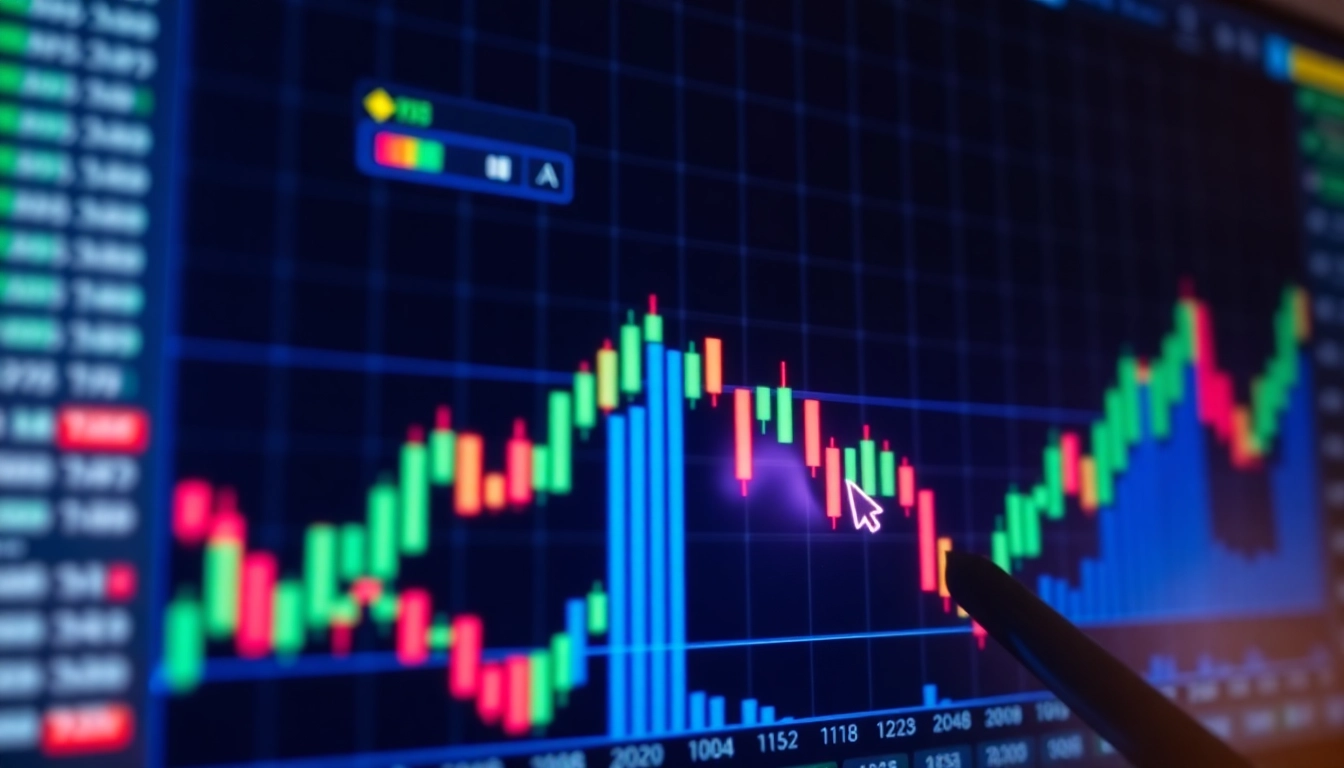
Effective trading hinges on clear visualization, which Trading View expertly facilitates through extensive customization options. Users can choose from numerous chart types—candlestick, bar, line, hollow candles—and adjust timeframes ranging from seconds to monthly periods. Advanced users often tailor these charts with color schemes, grid styles, and background themes to optimize visual clarity.
Adding or removing indicators is straightforward with the platform’s drag-and-drop interface. Typical indicators like Moving Averages, Bollinger Bands, MACD, RSI, and volume overlays help traders identify trends and potential reversals. Moreover, the platform supports creating custom indicators using Pine Script, Trading View’s proprietary scripting language. This enables traders to develop and deploy unique signals tailored to their trading strategies.
Furthermore, traders can create multiple chart layouts—such as side-by-side or overlay views—allowing simultaneous analysis of different assets or timeframes. They can save these configurations as templates for quick access during live trading sessions, ensuring their visual analysis remains consistent and efficient.
Integrating Indicators and Technical Analysis
Technical analysis on Trading View is bolstered by an extensive library of built-in indicators and drawing tools. Traders can combine multiple indicators to craft complex trading setups, such as divergence patterns or moving average crossovers. The platform also supports oscillators, volume profiles, and custom studies, providing deep insight into market dynamics.
One of the platform’s strengths lies in its community-generated ideas and scripts. Traders often share their custom indicators and strategies, which can be easily integrated into their own charts. This collaborative ecosystem accelerates learning and helps traders discover innovative methods of analysis.
Beyond visual overlays, Trading View offers a comprehensive set of analysis tools—price pattern recognition, trendline analysis, and Fibonacci projections—that can be combined to validate trades. The goal is to develop a robust technical framework, which, when paired with real-time data and alert notifications, greatly enhances decision-making precision.
How to Optimize Your Trading Strategies Using Trading View
Utilizing Alerts and Automated Notifications
Effective trading depends on timely information, and Trading View’s alert system is central to maintaining that edge. Alerts can be set based on price levels, indicator conditions, or pattern formations. For instance, a trader might set an alert to notify when Bitcoin crosses a specific support level or when RSI indicates overbought conditions.
These alerts are pushed via pop-up notifications, emails, or SMS, ensuring traders do not miss critical market movements. Moreover, Trading View supports webhook integrations, facilitating automated trading or signal execution through third-party systems or trading bots. This automation capability streamlines workflows and reduces cognitive load during volatile trading sessions.
Implementing Pattern Recognition and Signal Generation
Pattern recognition is a vital aspect of technical trading, and Trading View simplifies its implementation through prebuilt tools and community scripts. Common patterns like head and shoulders, double tops/bottoms, or flag formations can be automatically identified or manually marked with drawing tools.
Furthermore, the platform’s scripting environment allows traders to develop custom pattern recognition algorithms. These scripts can generate buy or sell signals based on complex criteria, providing a systematic approach to trading. When combined with the alert system, pattern-based entries and exits become data-driven, reducing emotional bias in trades.
Backtesting and Analyzing Historical Data
Backtesting is essential for validating trading strategies before deploying real capital. Trading View offers an integrated backtest environment that allows users to simulate trades over historical data. Traders can then assess the effectiveness of indicators, entry/exit points, and risk management rules.
Results are presented in comprehensive reports that include profit/loss metrics, drawdowns, and win rates. This feedback loop enables continuous strategy improvement. Additionally, users can optimize settings within scripts or indicators to refine performance based on past market conditions, leading to more robust future results.
Real-World Examples of Trading View in Action
Successful Trading Strategies with Trading View Insights
Many professional traders leverage Trading View to develop and refine their strategies. For example, a common approach involves using moving averages and RSI to identify trend reversals and confirm entry points. Traders set alerts for crossover signals and monitor community ideas for market sentiment shifts, enabling swift decision-making.
Backtesting these setups against historical data might reveal a high success rate during trending markets, prompting traders to adapt their positions accordingly. Real-time chart analysis combined with alerts facilitates quick reactions, leading to profitable trades, especially in volatile assets like cryptocurrencies or forex pairs.
Case Studies of Market Predictions and Outcomes
Consider a case where a trader predicted a bullish breakout in the S&P 500 based on pattern recognition tools available on Trading View. By observing a descending triangle pattern and aligning it with volume spikes and moving average crossovers, the trader set alerts to monitor the breakout confirmation.
As the breakout occurred, the trader executed an order, and subsequent analysis showed a favorable profit. Sharing the case in the community ideas section garnered feedback and additional insights, demonstrating the platform’s value for collaborative learning and strategic refinement.
Community Ideas and Sharing Best Practices
The active social aspect of Trading View fosters an environment where traders exchange ideas, scripts, and strategies. Top-performing insights often include detailed chart setups, annotated trend analyses, and custom indicator scripts. Engaging with this community allows traders to stay ahead of market trends, learn new techniques, and adapt their strategies based on collective wisdom.
Addressing Common Challenges and Maximizing Efficiency
Overcoming Information Overload
With a plethora of data, indicators, and community ideas, traders risk becoming overwhelmed. To mitigate this, effective workspace management is crucial. Focus on relevant assets, set specific alert thresholds, and utilize templates to streamline analysis. Regularly cleaning dashboards and limiting active indicators helps maintain clarity and focus.
Ensuring Data Accuracy and Script Reliability
While Trading View sources data from reputable providers, discrepancies can occur, particularly in less liquid markets. Traders should cross-verify critical information and avoid over-reliance on automated scripts without validation. Writing and testing custom scripts in Pine Script with thorough debugging ensures reliability, reducing false signals that could compromise trades.
Optimizing Platform Performance for Fast Decision-Making
Speed is essential in trading. To enhance performance, traders should optimize their internet connection, avoid running excessive indicators, and update their software regularly. Using hardware-accelerated devices or dedicated applications for alerts can further improve reaction times, translating into better trade execution.
Future Trends and Innovations in Trading View Tools
Emerging Features and Integrations
Trading View is continuously evolving, with upcoming features like enhanced AI-driven analysis, integrated order execution, and expanded asset coverage. New integrations with brokers and third-party analytics platforms will streamline workflows, allowing for seamless automation from analysis to execution.
AI and Machine Learning Enhancements
Trends indicate increasing incorporation of AI into market analysis, with predictive models and sentiment analysis tools becoming more accessible within Trading View. These advancements will help traders identify hidden patterns, forecast market movements, and automate complex strategies with higher accuracy.
Expanding Social Trading and Community Engagement
The social features of Trading View are set to expand, fostering more interactive learning environments. Features like live charts, collaborative analysis, and real-time discussion channels will make it easier for traders to share insights, backtest strategies collectively, and develop community-driven trading signals.